Wild Leadership
Gen X at Work
For journalists
Three stories, five figures with their sources, images you can use, and how to reach me.
The work is already published, so there is no exclusive to give. magnus@wildleadership.co
Three stories, five figures with their sources, images you can use, and how to reach me.
The work is already published, so there is no exclusive to give. magnus@wildleadership.co
Everything on this site strengthens one of them. Each has its own page with every figure and account filed to it.
Generation X is running British companies.
Three in four managers, directors and senior officials in England and Wales are aged 35 to 64. The average FTSE 150 chief executive was born in 1969. The chairs average 65. And they own it: the median person controlling a substantial British company is 60, by my own count of the Companies House register.
Nobody tells you what the top is really like.
Nine years inside the company to get the job, at 52. Gone at 59. Seven years in the chair. Of those who have left, seven per cent got another top job. I call the top The Apex. The place where you have two jobs: deliver growth, defend your position.
This generation is being pushed out of work before it reaches a pension. Getting back in is harder, and it pays less.
2.9 million between fifty and pension age, neither working nor retired. Back at 9.5 per cent less. No re-employment figures in the government’s own table.
Every figure is in The newsroom, with its source, base and period.
My count
The people who own Britain's substantial private companies have a median age of 60. Almost four in five are over fifty. Nobody had counted.
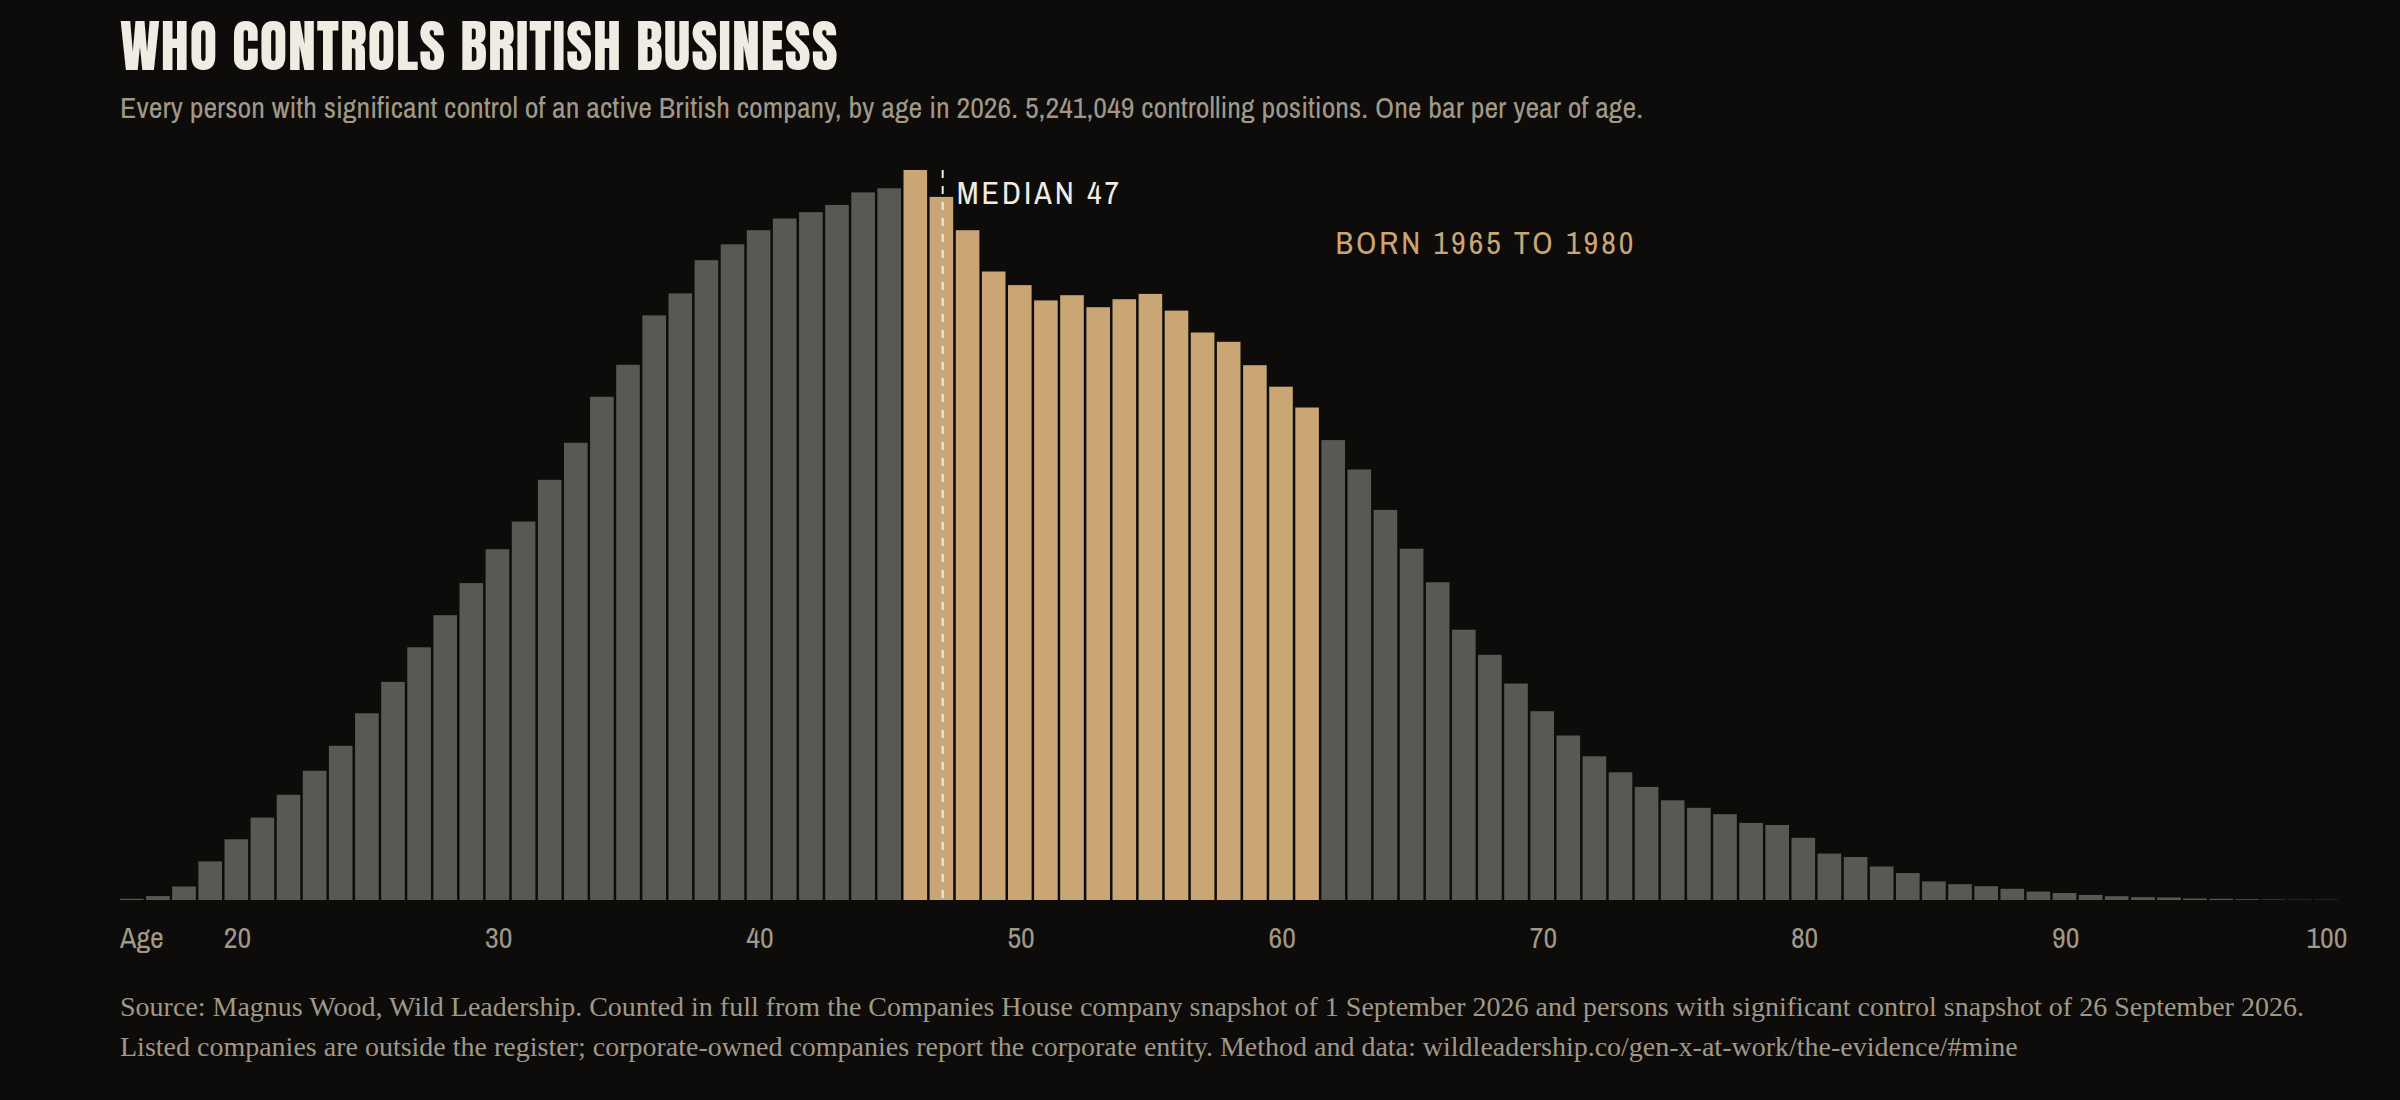
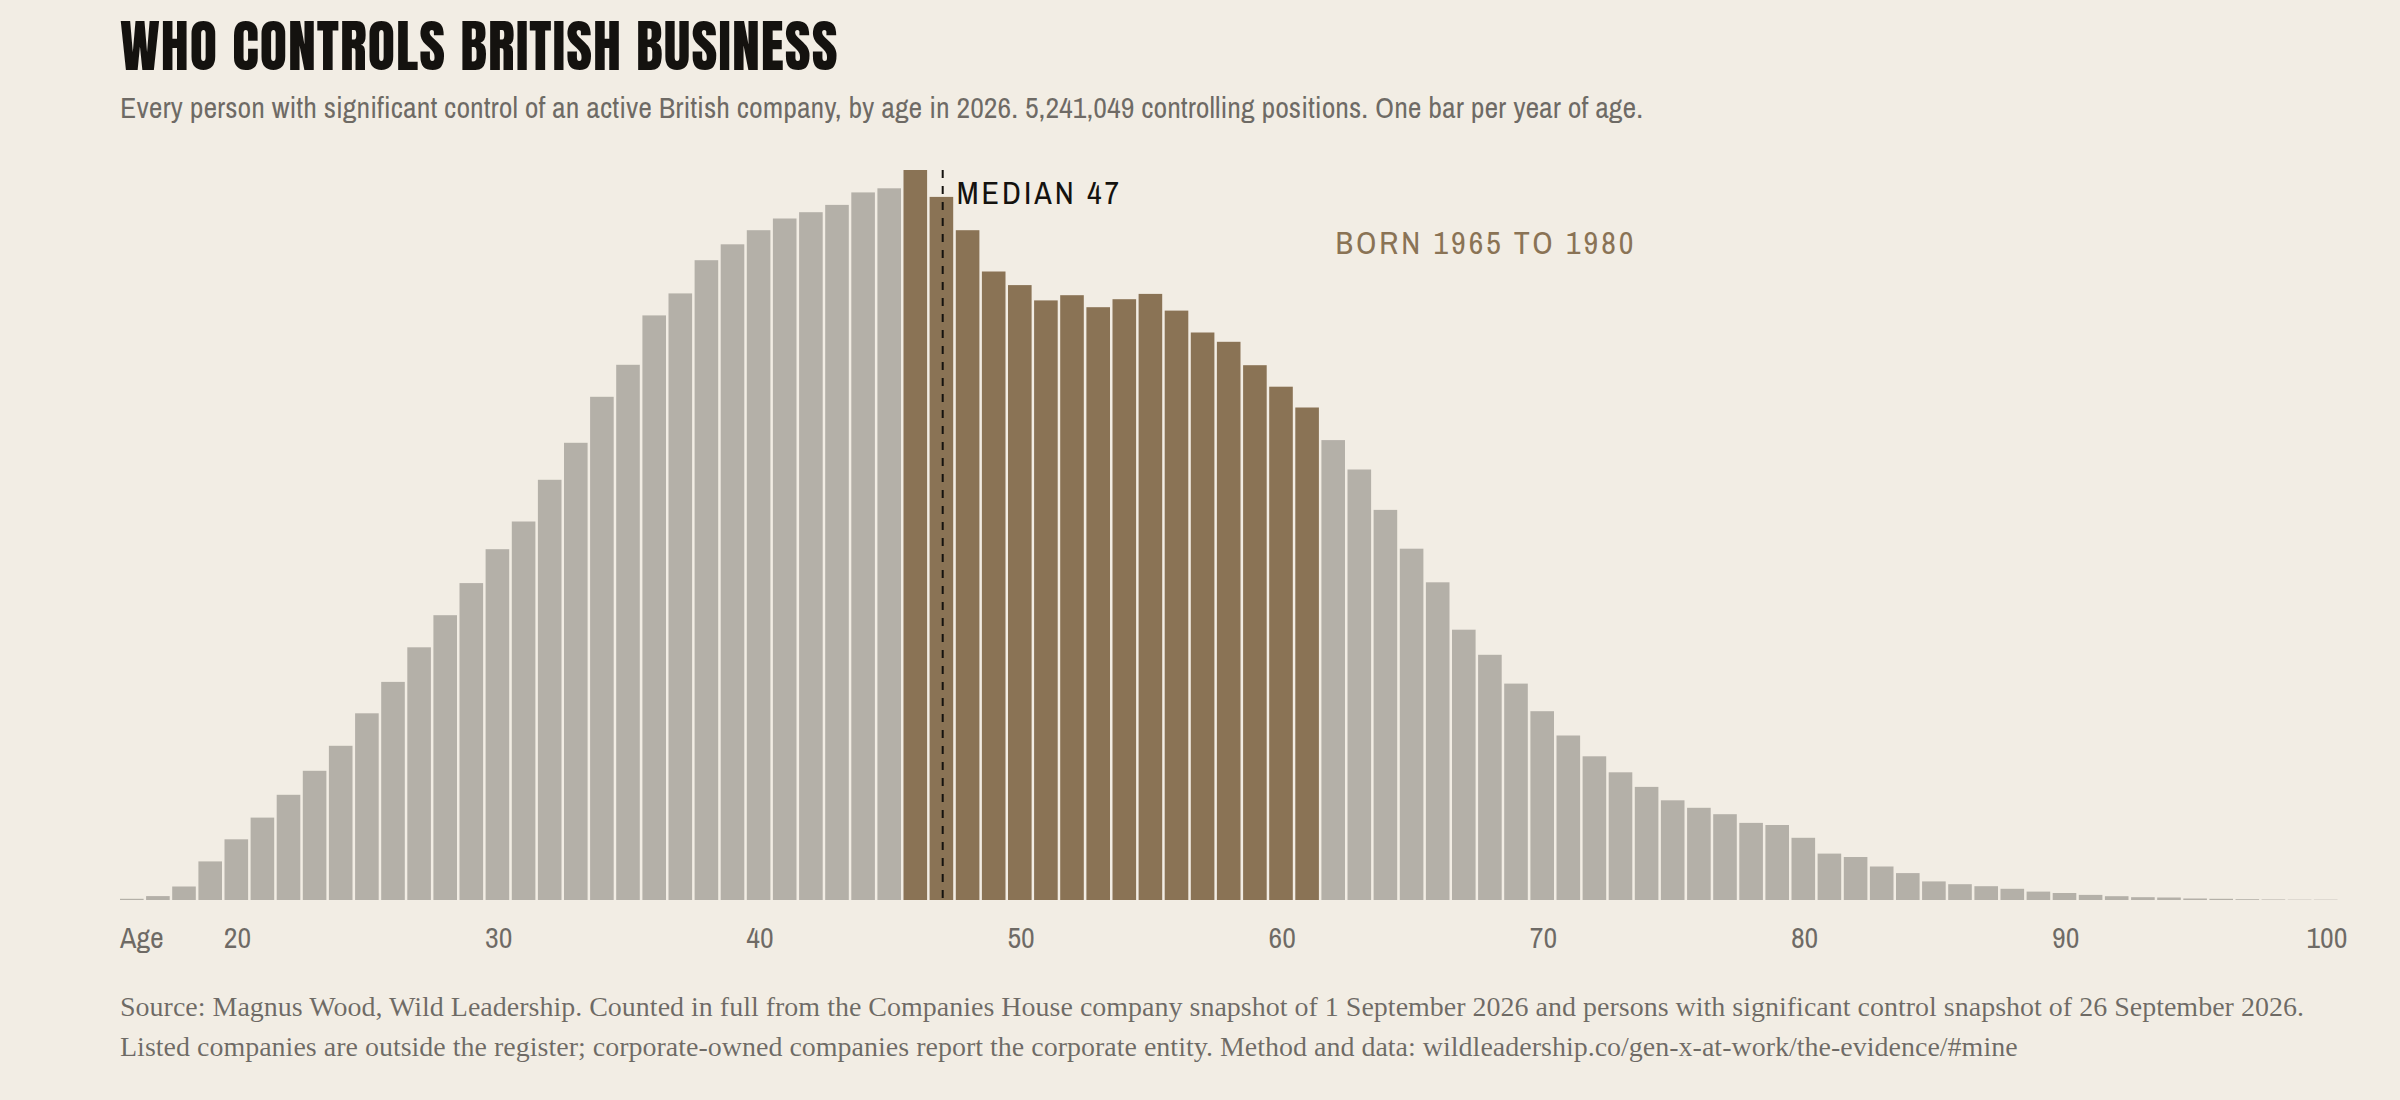
Companies House has published, free, the month and year of birth of every person with significant control of a British company since 2016, and nobody had turned it into an answer. I analysed the whole register: 5,241,049 individual controlling positions across 5,171,600 active companies, with no sampling. Among positions at companies above the small-company threshold the median age is 60 and 79.8 per cent are held by someone aged 50 or over. Across the wider register the median is 47. It counts positions rather than unique people: someone controlling several companies appears more than once. The findings, the downloadable tables and the full method are below.
The regional story. Across all companies analysed, London has the youngest recorded controllers, with a median age of 45. The South West has the oldest, at 50. The proportion aged 50 or over is 37.7 per cent in London and 52.2 per cent in the South West. Among companies above the small-company threshold, the median is between 59 and 61 in every region and nation. Download the regional table for figures covering your area.
The accounts comparison. Median age rises across the accounts categories analysed, from 48 for micro-entities to 62 for companies filing full accounts.
Download the data. Three tables: by age by accounts category by region
What these figures cover. The analysis covers individual controlling positions recorded on the Companies House register of people with significant control. Companies with shares traded on a UK regulated market are outside that regime, and a company owned through another company reports the company rather than a person, so the larger-company findings relate to private companies with an identifiable individual controller recorded in the data.
These figures should not be presented as the age profile of all British business owners, chief executives or FTSE leaders. Corporate controlling entities are not included in the individual age count. Each position carries equal weight: someone controlling several companies is counted several times. Age is calculated as 2026 minus birth year and may be one year higher than the person's age on the analysis date. The underlying register is self-declared and unaudited.
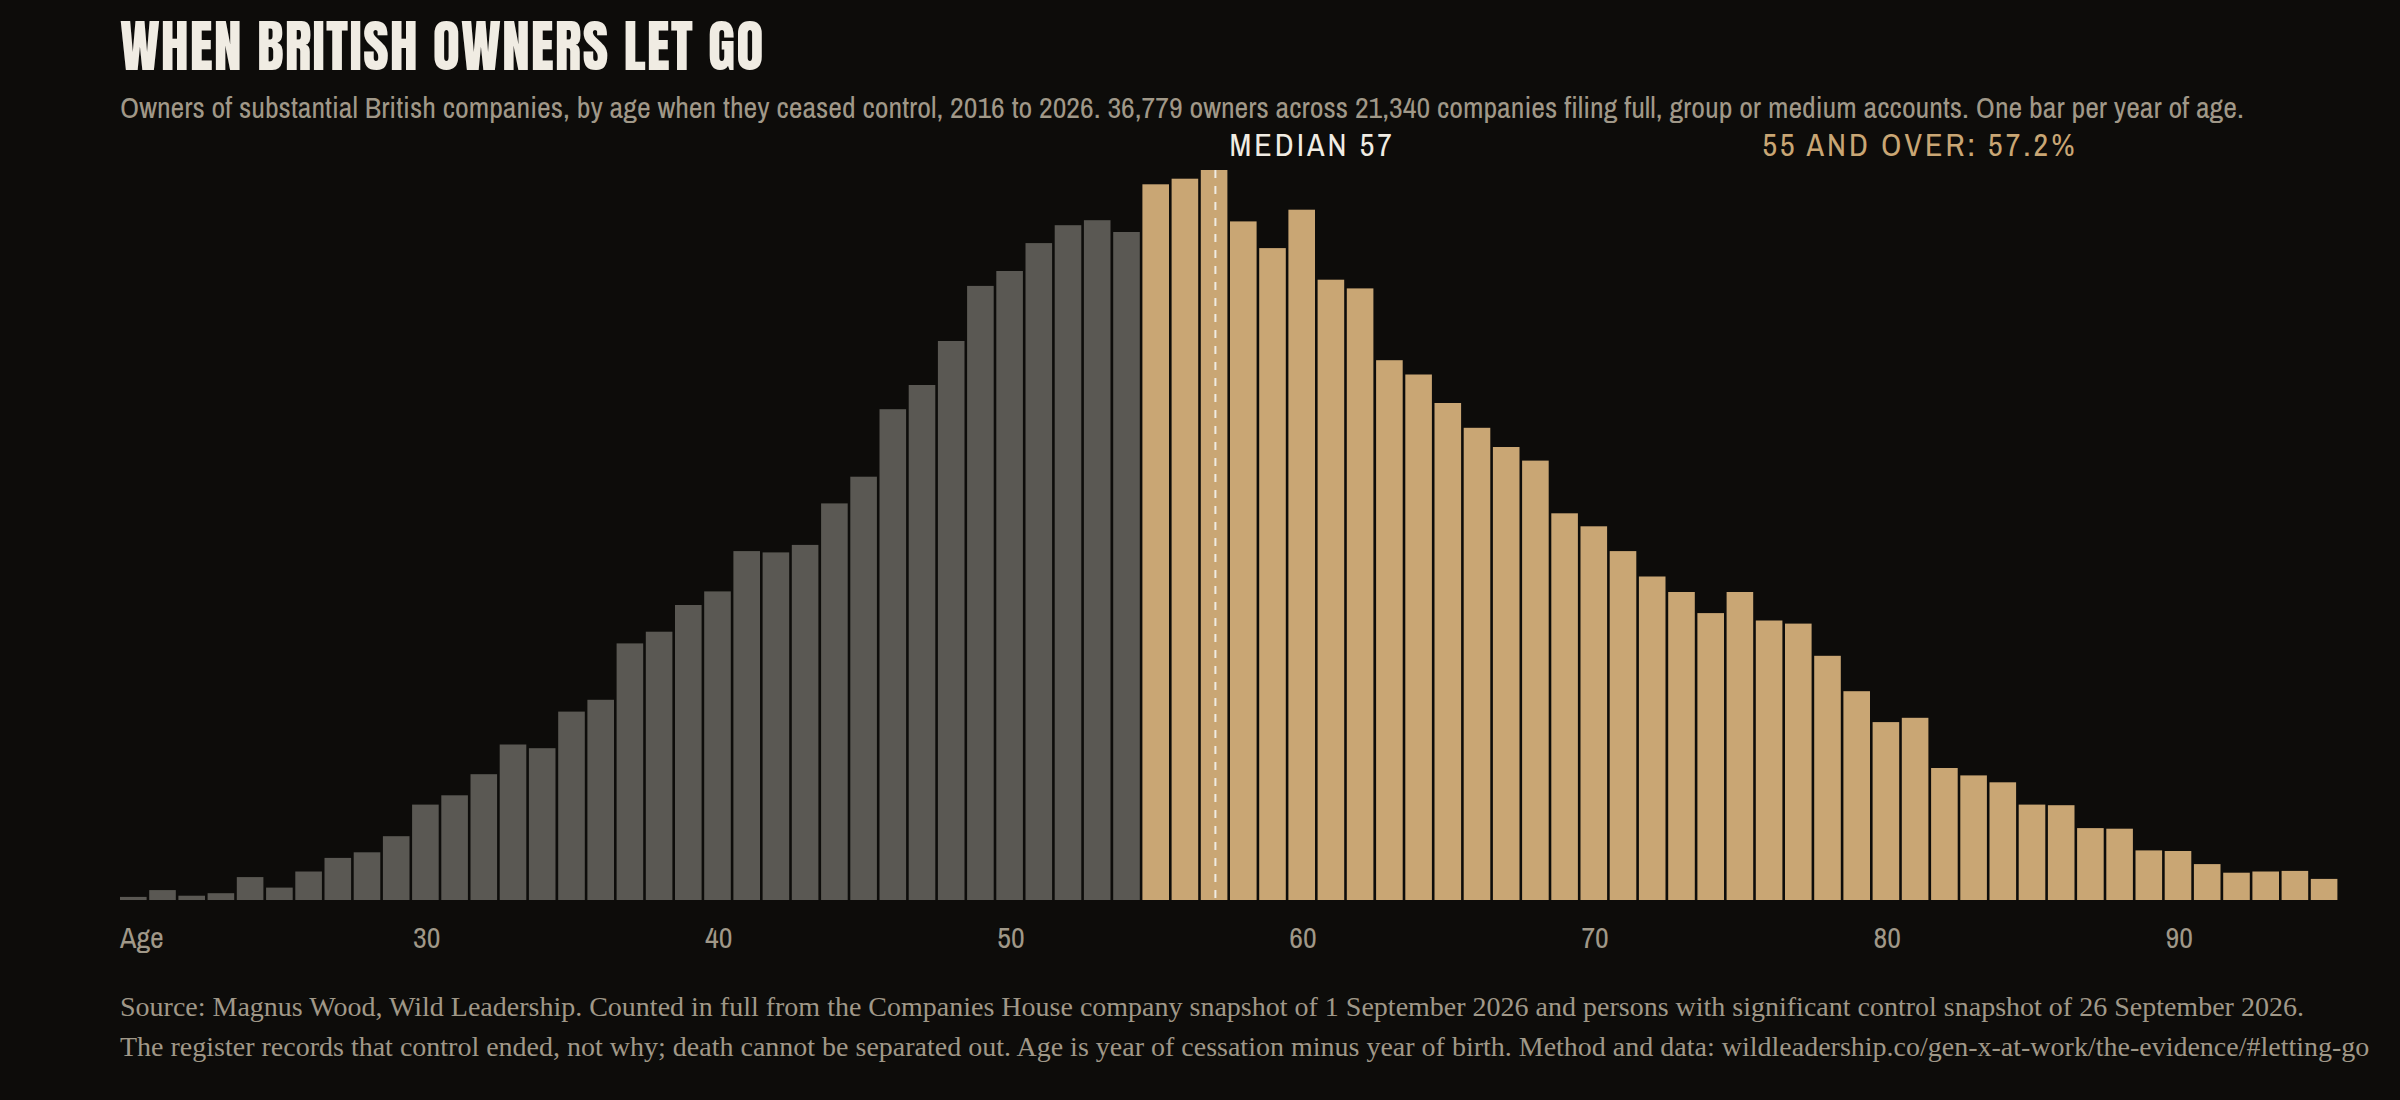
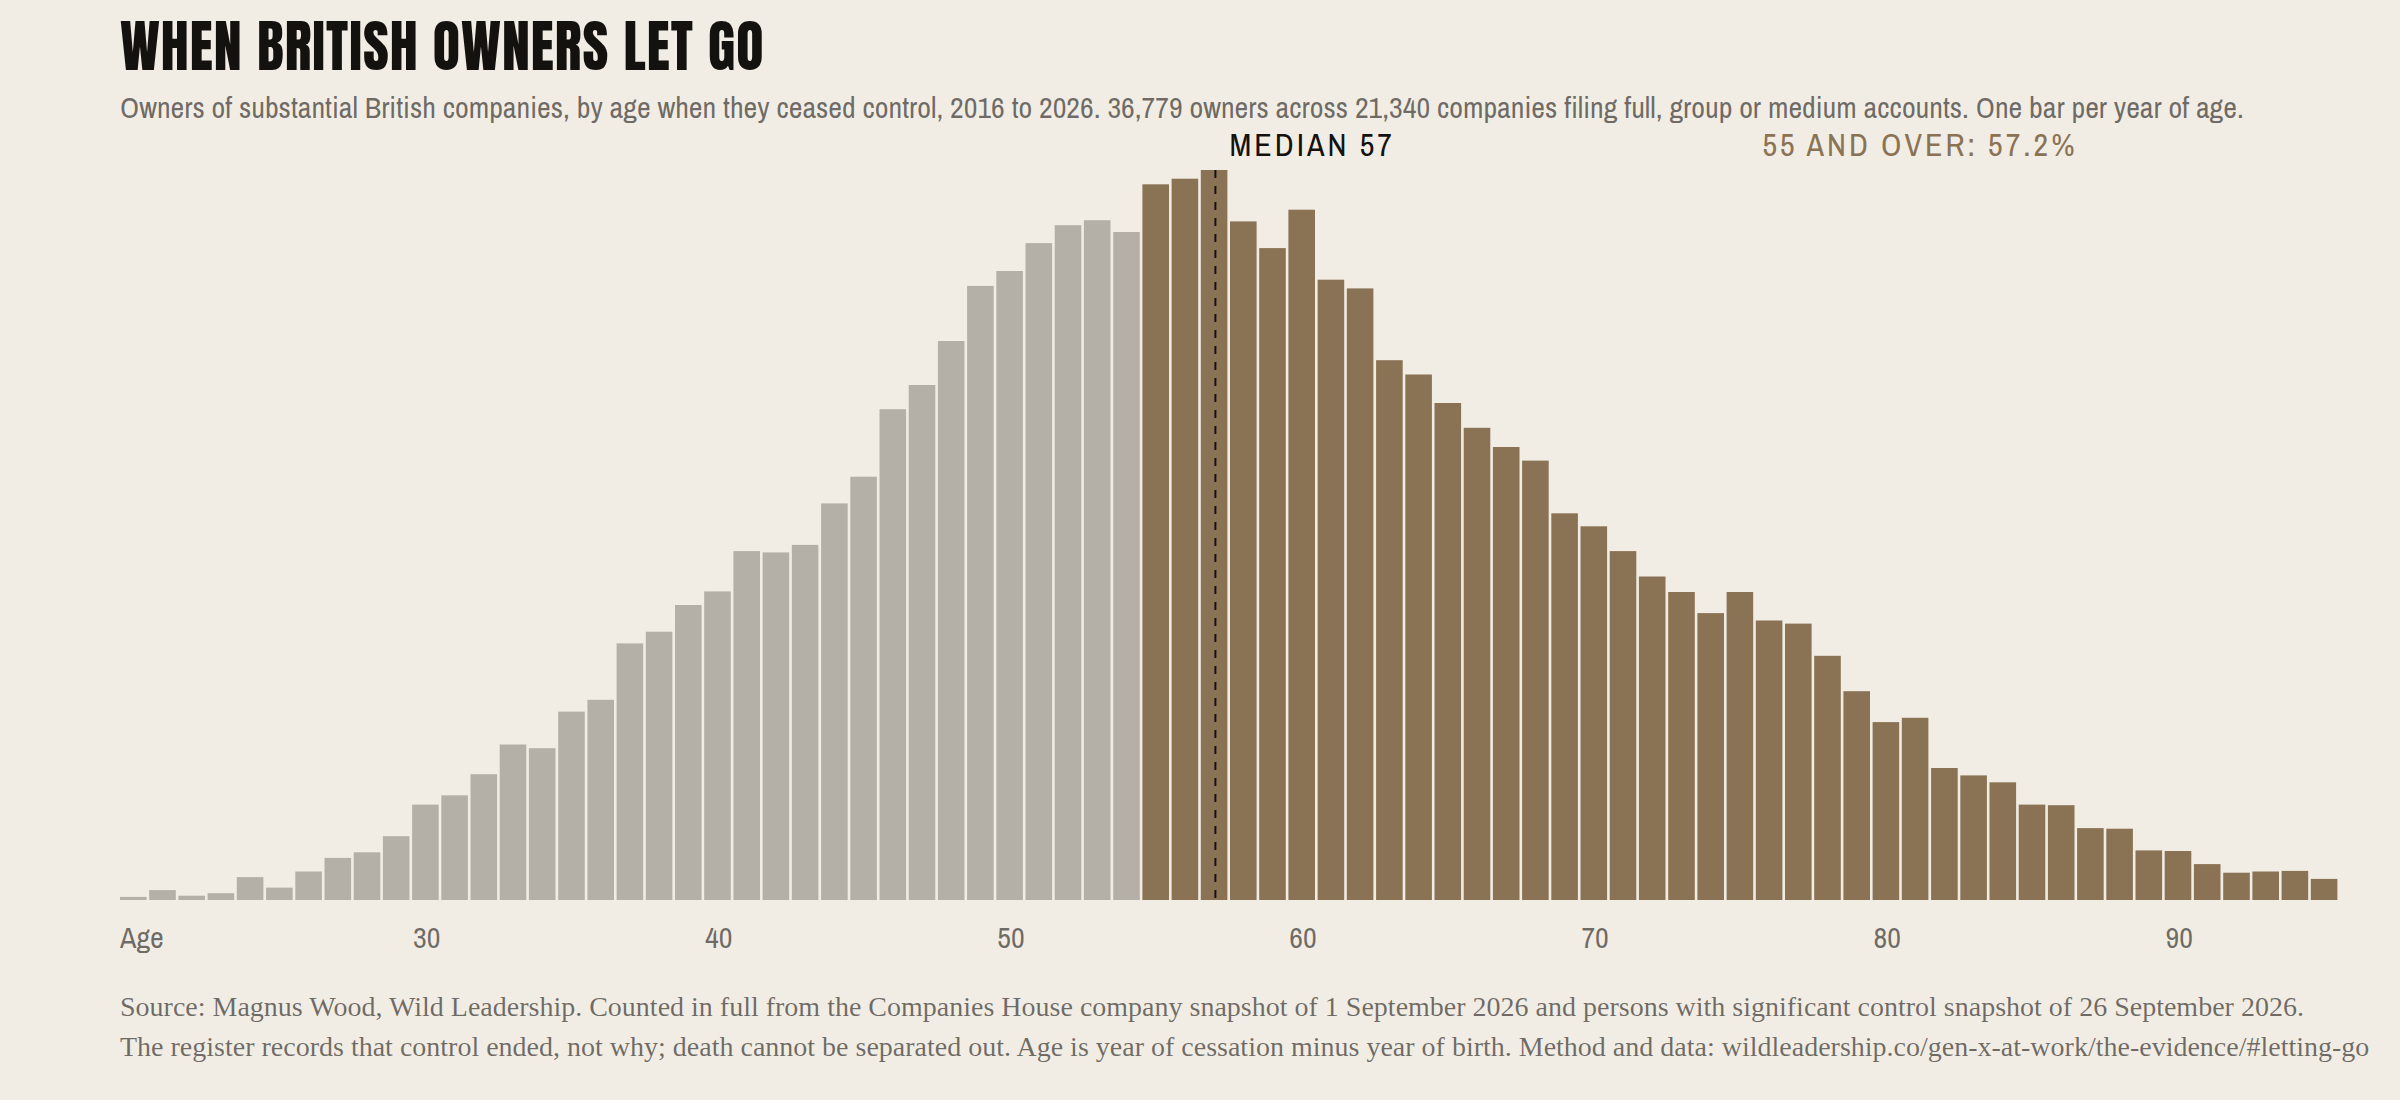
The same register records when a person stops controlling a company, and those entries stay in the file. There are 1,010,685 of them at companies still trading. I counted them on 28 September 2026. At substantial companies, the ones filing full, group or medium accounts, the owner who let go had a median age of 57 and 57.2 per cent were 55 or over. 34.3 per cent of those companies were bought by an unconnected company, 26.3 per cent restructured under a holding company, 23.9 per cent passed to another individual. Owners who sold went at 55; owners who handed on to a person went at 62. Purchases peaked at 916 in 2021 and have not returned to that level.
Two things travel with it. A corporate owner appearing after an individual departs looks like a sale; where its name shares a word with the company’s or carries the departing owner’s surname it is a holding company, and separating those takes acquisition from 61 per cent of handovers to 34. And the register records that control ended, not why: sale, retirement, illness and death file identically.
The count by sector, against the reader’s own age, is at wildleadership.co/gen-x-at-work/letting-go/. Every sector is its own address, for example ?sector=food-manufacturing. The method, the caveats and two data tables are on the evidence page.
Sources and method. Analysis completed on 27 September 2026, using Companies House basic company data dated 1 September and the persons with significant control snapshot dated 26 September, both free at download.companieshouse.gov.uk. The full method, filters and tables are in The Years That Made Us. Suggested credit: Magnus Wood, Wild Leadership, analysis of the Companies House PSC register, September 2026.
The numbers tell a fairly simple story. This generation is running British companies. It is also being pushed out of work before it reaches a pension. Getting back in is harder than getting in was the first time, and it pays less.
The census counted 3,547,854 managers, directors and senior officials in England and Wales. Three in four were aged 35 to 64. Only 2.6 per cent were under 25.
ONS, Census 2021, table RM102. A full count of everyone, not a survey, and the most recent. The census runs once a decade. England and Wales. SourceAverage chief executive age across Britain’s largest 150 listed companies was 56.2 at 30 April 2025. That is a birth year of 1969. Chairs average 65.3, so the generation running these companies is a different one from the generation chairing them.
Spencer Stuart, 2025 UK Board Index. Company age disclosure is voluntary. SourceAcross every active British company, the median person with significant control is 47. Among the 30,999 controlling positions in companies above the small-company threshold the median is 60, four in five are fifty or over and more than half are sixty or over. 38.6 per cent of all controllers were born between 1965 and 1980.
My own count, 27 September 2026, from the Companies House company and persons-with-significant-control snapshots, 5,241,049 positions, processed in full. Listed companies are outside the regime and corporate-owned companies report the corporate entity, so the substantial-company figure describes firms still controlled by an identifiable person. Method and data files at the link. Source2.9 million people between fifty and the state pension age are not in employment, education, training or retirement. That is 21 per cent of the age group. 1.7 million of them are women. Nearly 925,000 were interested in work or actively looking, the most since 2020.
Centre for Ageing Better, NETER: a New Labour Market Measure, 7 September 2026. SourcePeople over fifty who lost a job and found another went back on hourly pay 9.5 per cent below what they had been earning. Fewer than two in three were in work again within six months, against around three in four of those under fifty.
Resolution Foundation, A U-shaped crisis, 26 April 2021. Twenty years of hourly earnings data. SourceSixty-one per cent of sitting chief executives say they are considering another chief executive role. Of the ones who have already left, seven per cent have taken one. Another fifty-four per cent took a non-executive seat instead, advising a board rather than running a company. These are two groups inside one survey, not a conversion rate.
Spencer Stuart, CEO Transitions: How to Avoid a Bumpy Exit, October 2025. More than 1,000 current and former chief executives in Asia, Europe and North America. SourceOne thing cuts the other way, so it is here too. Through the 2010s the over-fifties were made redundant at up to 1.43 times the rate of people aged 35 to 49. That has now reversed. In 2026 the highest redundancy rate of any age band is among 35 to 49 year olds. Losing the job is not the unusual part. Getting back is.
ONS table RED02, edition published 15 September 2026. Calculated by averaging the rolling three-month estimates within each calendar year. Source
Free to use with the credit Wild Leadership. The two portraits are photographs of me. The cover image and everything else on the site is AI generated and should not be run as documentary imagery. Each link opens the full-size file.
Download all six images with a credit file, 1.6 MB zip
 Magnus Wood, 2026. Photograph. 900×1200. Credit: Wild Leadership.
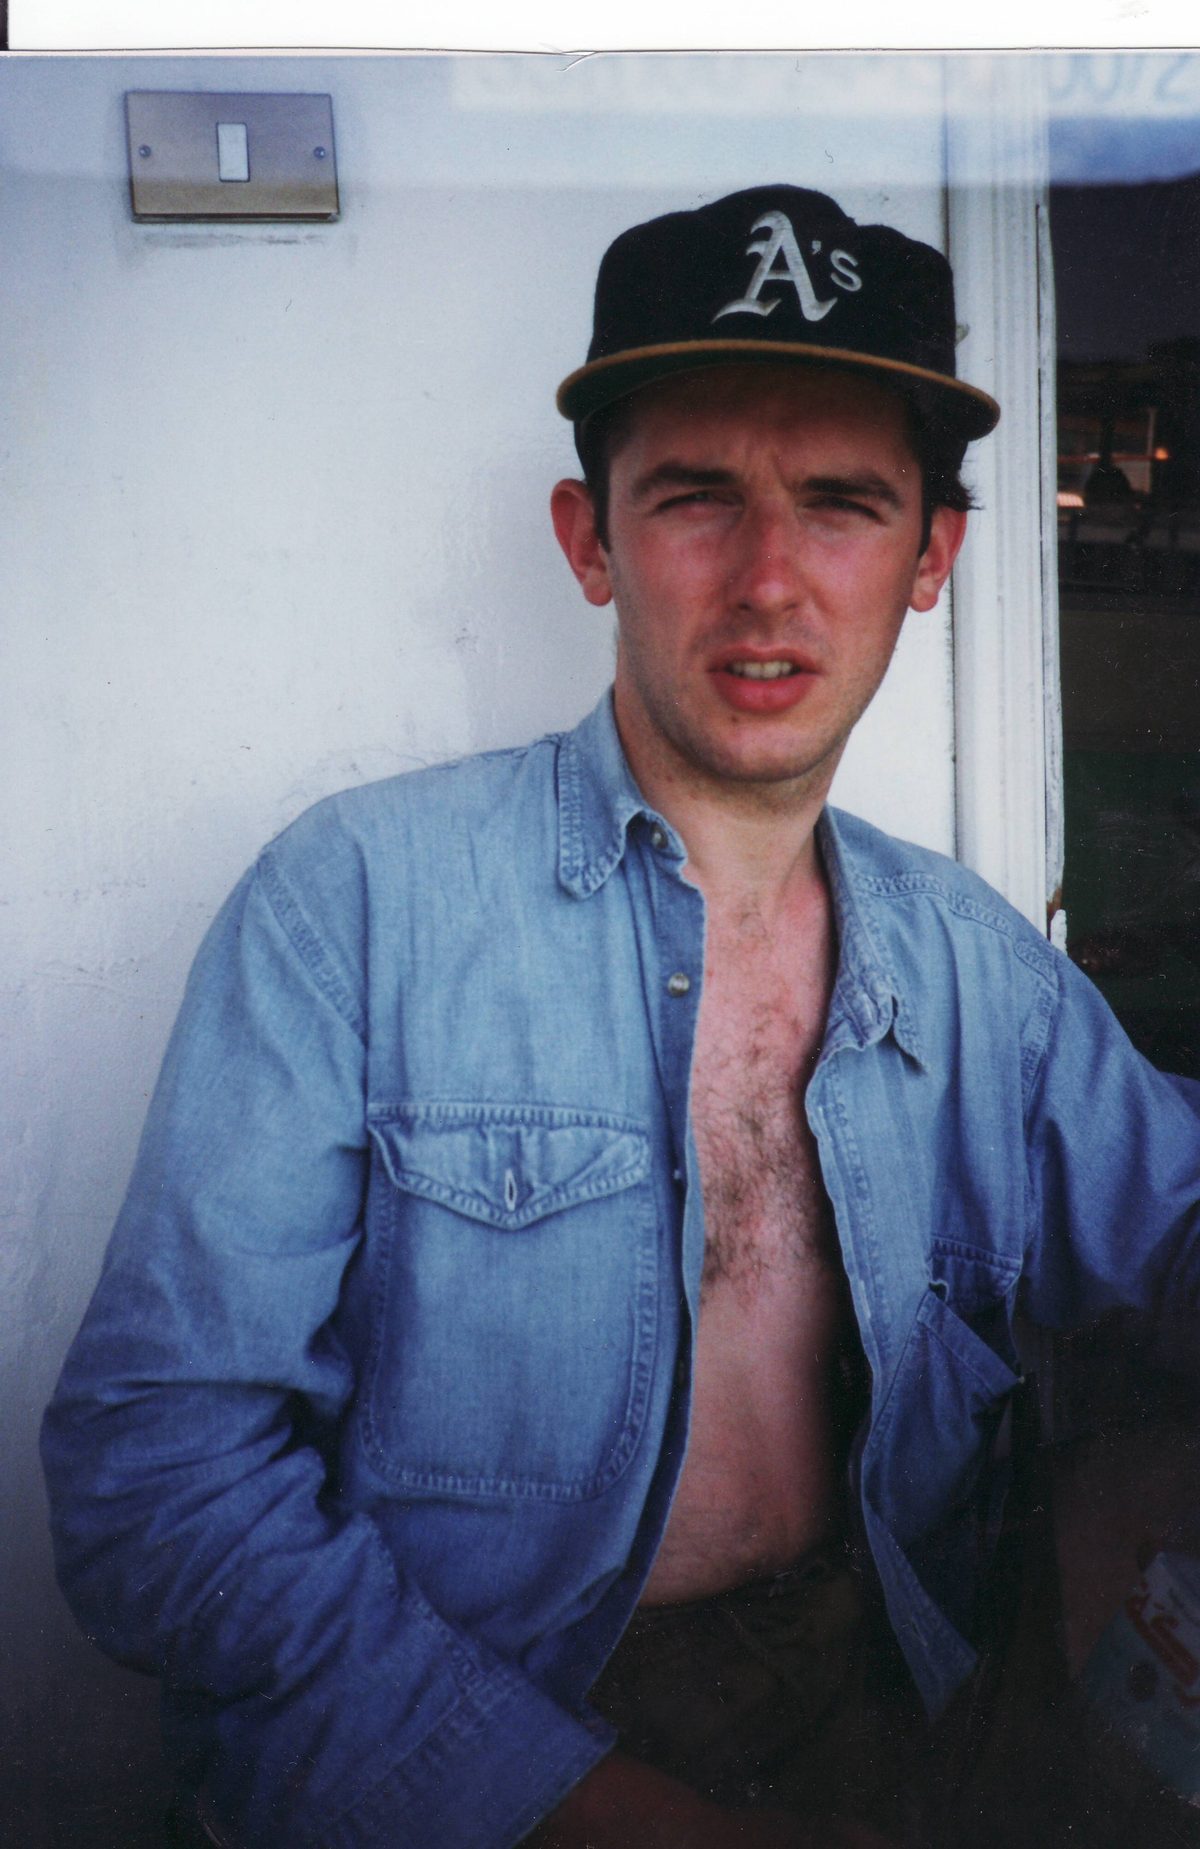 Magnus Wood, earlier. Photograph. 1200×1849. Credit: Wild Leadership.
 Crazy Paving cover image. AI generated. 1536×1024. Credit: Wild Leadership.
A reader who finishes Crazy Paving can make a card for their own birth year and post it. These three are real output, not mockups, 1080×1350 each. Every card carries genxatwork.com. Click to open the full-size file.



Link to genxatwork.com. It goes to the front door, the three stories with every figure filed to them. genxatwork.com/crazypaving goes straight to Crazy Paving, the report that carries the argument.
The Years That Made Us sits underneath it. Fifty years of entries, each one naming the source it came from. Most readers will not go that deep and they do not need to.
On the Record is where people who have done the job write down what it was actually like. That is where I want readers to end up.
Use the figures. Check them in The newsroom, where each carries its source, base and period. Download the images above.
If you want to talk about what happened to Generation X at work, why so many of its leaders are now reaching the edge of the top job, or what happens afterwards, email me.
I can also talk about how the research was built, what I could not find, and where the gaps in the British data still are.
On the Record is collecting now. People who ran things are writing down what they expected the job to be and what it turned out to be. I will show you what arrives before it goes up.
The work is already published, so there is no exclusive to give.
Wild Leadership, Sevenoaks, Kent. UK time.
Magnus Wood.
Three times at the top of a business. Left three times, not always when I chose. That is why I built this.
I was born on the edge of Generation X. The working life in The Years That Made Us is mine too. I will talk about all three exits, including the ones I did not choose.
I have spent more than thirty years inside large companies and startups. I have led at board level in private equity-backed businesses where capital has a clock and alignment failures have consequences.
I write about Wild Leadership. Leaders get domesticated by the organisations they lead. I have some answers for them.
I was born in Scotland and have spent most of my adult life in London. I am married and live in Sevenoaks, Kent. I have two grown-up daughters.
In 1997 a careers piece in The Independent told a generation of graduates there was no career path any more and they would have to lay their own. Crazy paving was the phrase used. They did it. Crazy Paving is twenty-one screens on where it went.
It covers the flattening of middle management in the mid-nineties, the arrival of the internet in British offices, the end of the job for life, the 2008 crash, the decade of redundancy that followed, and what is happening now to people in their fifties who are still twelve years from a pension.
Every figure on it is in The Years That Made Us with its source. The images are AI generated and the page says so on its first screen. The photographs of me are real.
Published September 2026 at wildleadership.co/gen-x-at-work/crazy-paving.
I am not a researcher and this is not a study. It is a record, built from published sources with the sources attached, so you can check it or disagree with it. Two counts are my own, of who controls British business and of when owners let go, both from the Companies House register. They are marked as mine and each carries its method and its data so you can repeat it.
236 of the 264 entries link to their source. Where two sources conflict, the entry names both and says which one it uses. Where a figure is old, or measures what people think rather than what happened, it says that. Sixteen things I looked for and could not find are published alongside the record, each with a note on where I looked. If something is wrong, tell me and it gets changed with the change noted.

Twenty-one screens on what was done to this generation on the way in, and what is being done to it now.
Every figure on it is in The Years That Made Us with its source.
Read it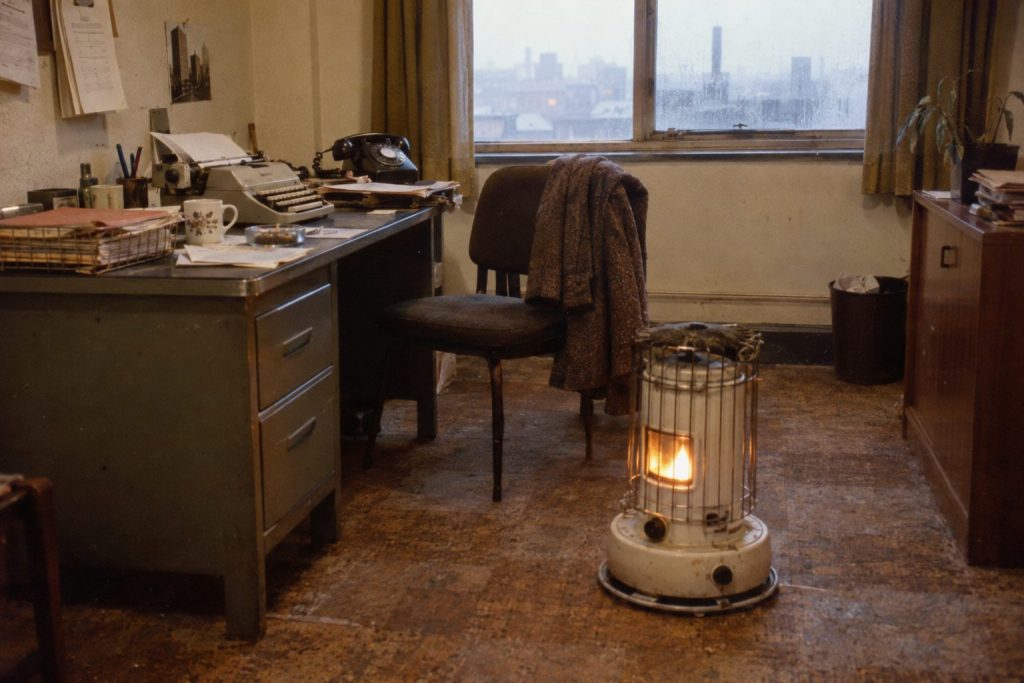
264 entries, 1976 to 2026. Put in the month and year you were born and it rebuilds around your age.
236 of them link to their source.
Open it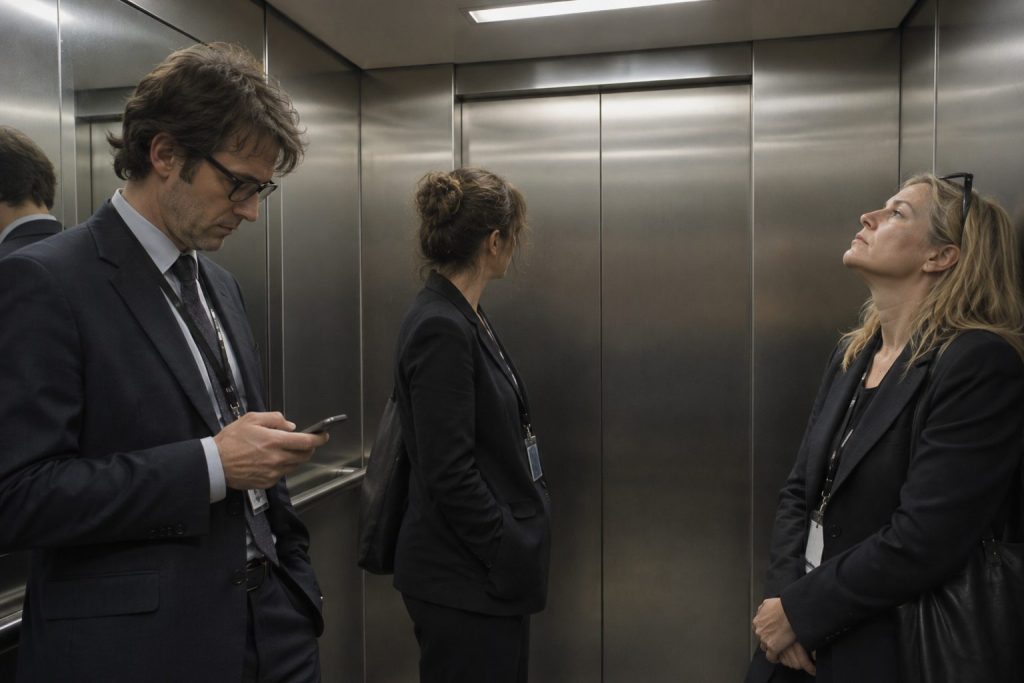
What people who got to the top expected the job to be, and what it turned out to be. First names only.
It is collecting now.
See it